Online Retail Sales Analytics — SQL Server & Power BI
This project delivers an end-to-end analytical overview of online retail performance using SQL Server for data preparation and Power BI for interactive reporting. The dashboard provides insights into revenue trends, customer behavior, product contribution, and geographic performance.
Business Questions Addressed
- What are the monthly and yearly sales trends?
- Who are the top customers and how do they behave?
- Which products generate the most revenue?
- Which countries and continents drive the highest sales?
- Are there indicators of customer churn?
BI Workflow
1. Data Extraction
Raw retail data was imported into SQL Server for initial validation and profiling.
2. Data Cleaning & Preparation (SQL)
- Removed duplicates and invalid transactions.
- Handled missing customer IDs.
- Standardized dates.
- Computed Revenue (Quantity × UnitPrice).
- Validated Customer, Country, and Product fields.
3. Data Modeling (Star Schema)
A clean, efficient star schema was designed, including:
- FactSales
- DimDate
- DimCustomer
- DimProduct
- DimCountry (with Continent field)
4. ETL & Data Transformation (Power Query)
- Corrected data types.
- Added Continent classification using conditional logic.
- Created full date table for time intelligence.
- Cleaned product and customer fields.
5. KPI & DAX Development
- Total Revenue
- Total Quantity Sold
- MoM Revenue %
- Average Order Value (AOV)
- Retention & Churn Rate
- Units per Transaction (UPT)
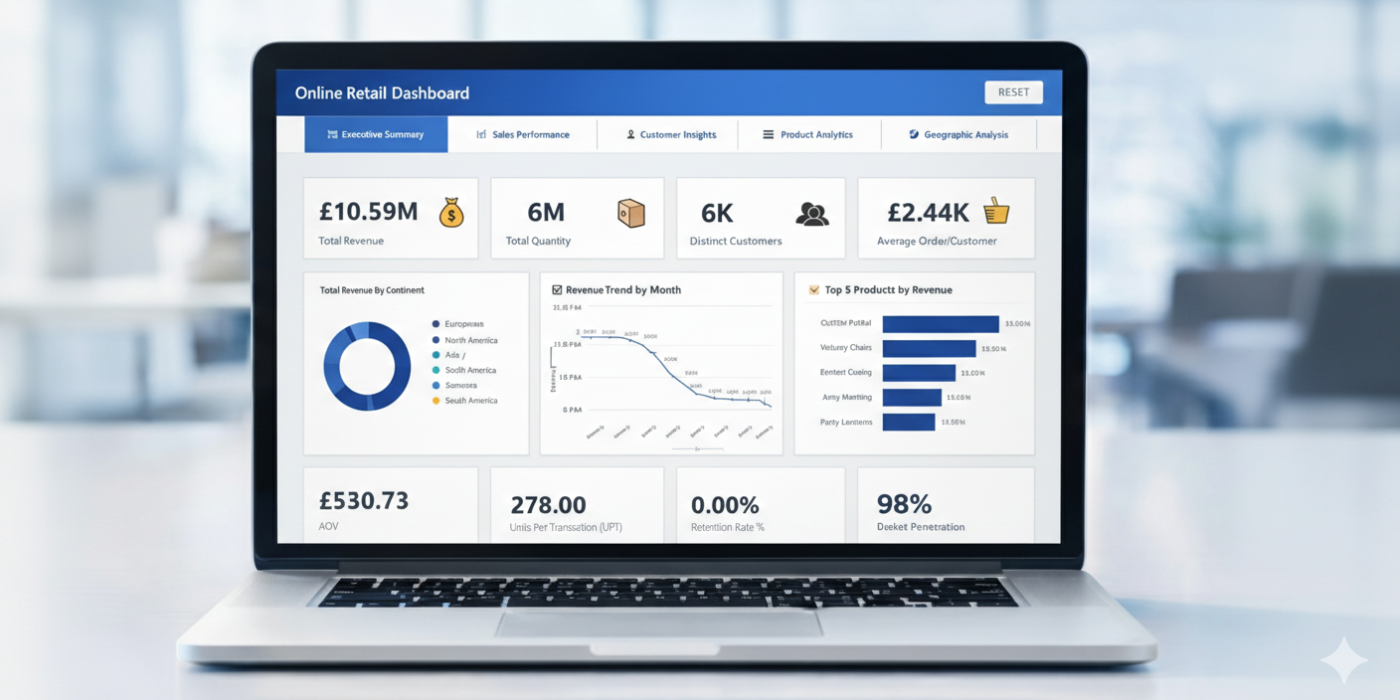
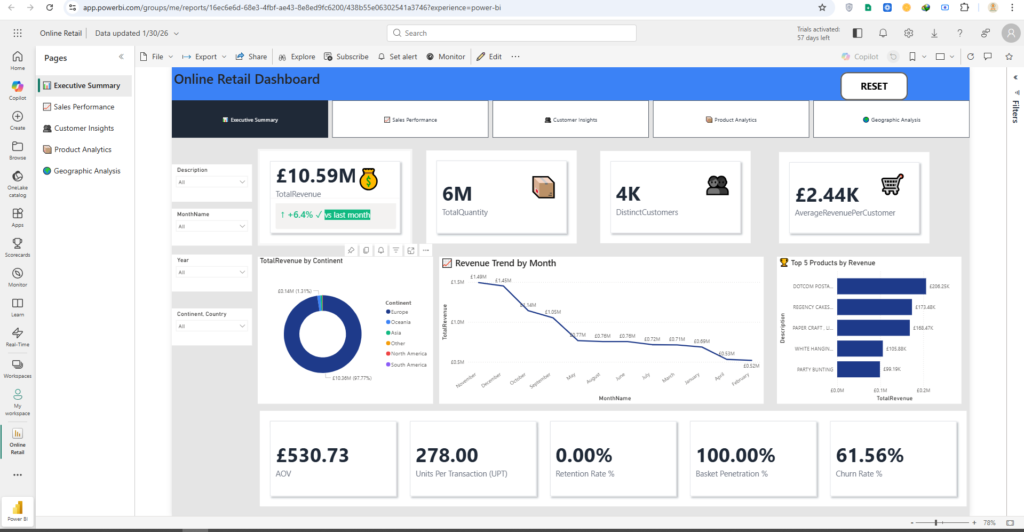
Dashboard Overview
The report contains 5 interactive pages:
- Executive Summary: High-level KPIs, global revenue, overall performance.
- Sales Performance: Monthly trends, YoY growth, best/worst months.
- Customer Insights: Segmentation, retention, churn analysis.
- Product Analytics: Top sellers, contribution %, product performance.
- Geographic Analysis: Sales by country, continent, regional patterns.
Key Insights
- Europe generates the majority of revenue.
- November is the peak sales month.
- A small number of products drive most revenue.
- Customer retention is low, increasing dependency on new buyers.
Recommendations
- Develop retention programs (loyalty, discounts).
- Expand into underperforming geographic regions.
- Reduce reliance on top products by diversifying the catalog.
- Plan targeted promotions during strong seasonal months.
Tools & Skills
- SQL Server
- Power BI(DAX,Power Query)
- Data Modeling (Star Schema)
- BI Dashboard Design
- Data Cleaning & ETL Concepts
- Analytical Storytelling