Featured Project · 2025
M&E Dashboard —
Nutrition & Gender in Togo
An end-to-end data project built from scratch: field data collection, large-scale dataset processing, interactive Power BI dashboard, and a full analytical S&E report — grounded in real WHO and World Bank data (2019–2024).
🌍 Togo · WHO / World Bank · 2019–2024
Nutritional Status & Women’s Empowerment
Analysis — Togo National Survey
This project replicates the exact workflow of an M&E Officer in an international NGO or UN agency: designing a KoboToolbox field collection tool, processing a 1-million-household dataset in Python, building an interactive Power BI dashboard with 15 DAX measures, and writing a 7-section analytical report with operational recommendations.
1,000,000
Households simulated
23%
Stunting rate (WHO 2024)
72.4%
Child anaemia rate
64.3%
Exclusive breastfeeding
30,869
SAM cases simulated
34
Variables collected
KoboToolbox
Power BI
Python
DAX
Pandas · NumPy
Power Query
XLSForm / ODK
WHO / GHO Data
World Bank
Step 01
📋
Field Data Collection Form
Full XLSForm survey with 4 sections and 40+ questions: anthropometric
measurements (MUAC, weight, height), automatic SAM/MAM/Normal status
calculation, 8-group WHO Minimum Acceptable Diet score, and a women’s
empowerment module.
Step 02
🐍
1M-Household Dataset
Simulated 1,000,000 households using Python, calibrated on real WHO
regional statistics for Togo. 34 nutritional, gender, and socioeconomic
variables — with realistic urban/rural and wealth quintile disparities.
Step 03
📊
Interactive Power BI Dashboard
3-page dashboard: national KPIs, regional choropleth map, MAD score
by wealth quintile, gender empowerment radar. 15 DAX measures including
year-over-year variation. 5 cross-page synchronized slicers.
Step 04
📄
M&E Analytical Report
7-section report based on real WHO/GHO data: context, KPIs, regional
analysis, 2019–2024 trend, gender & empowerment, 9 operational
recommendations ranked by priority, and full source references.
📌 Real Data Sources — WHO / World Bank · Togo
23.0%
Stunting (Height-for-Age)
WHO/GHO · Under-5 · 2024
↓ −2.8 pts since 2019
5.7%
Global Acute Malnutrition
WHO/GHO · Under-5 · 2017
→ Latest available data
72.4%
Child Anaemia (6–59 months)
WHO/GHO · 2019
↓ Declining trend
64.3%
Exclusive Breastfeeding
WHO/GHO · Under-6 months · 2017
↑ Improving
40.7%
Anaemia in Women 15–49
WHO/GHO · 2020
⚠ Critical level
72%
Female Youth Literacy
World Bank · Ages 15–24 · 2022
↑ +8 pts since 2017
⚙️ Data Pipeline — End-to-End Cycle
📋
01
Collection
KoboToolbox
XLSForm · 4 sections · Auto-calculations
🐍
02
Processing
Python · Pandas
1M rows · 34 variables · WHO calibration
🔄
03
Transformation
Power Query
Types · Nulls · Optimization
📐
04
Modeling
DAX
15 measures · KPIs · YoY trends
📊
05
Visualization
Power BI Service
3 pages · Map · Slicers
📄
06
Reporting
M&E Analysis
7 sections · Recommendations
✅ Project Deliverables
📋
KoboToolbox Survey Form
Field-ready XLSForm household survey: 40+ questions across 4 sections,
automatic MUAC nutritional status (SAM/MAM/Normal), real-time MAD score
calculation across 8 WHO food groups. Directly deployable on kf.kobotoolbox.org.
🗂️
Python Dataset — 1M Households
CSV file · 1,000,000 rows · 34 variables · calibrated on real WHO/Togo
regional statistics. Urban/rural disparities and wealth quintile effects
accurately reproduced across all 5 Togolese regions.
📊
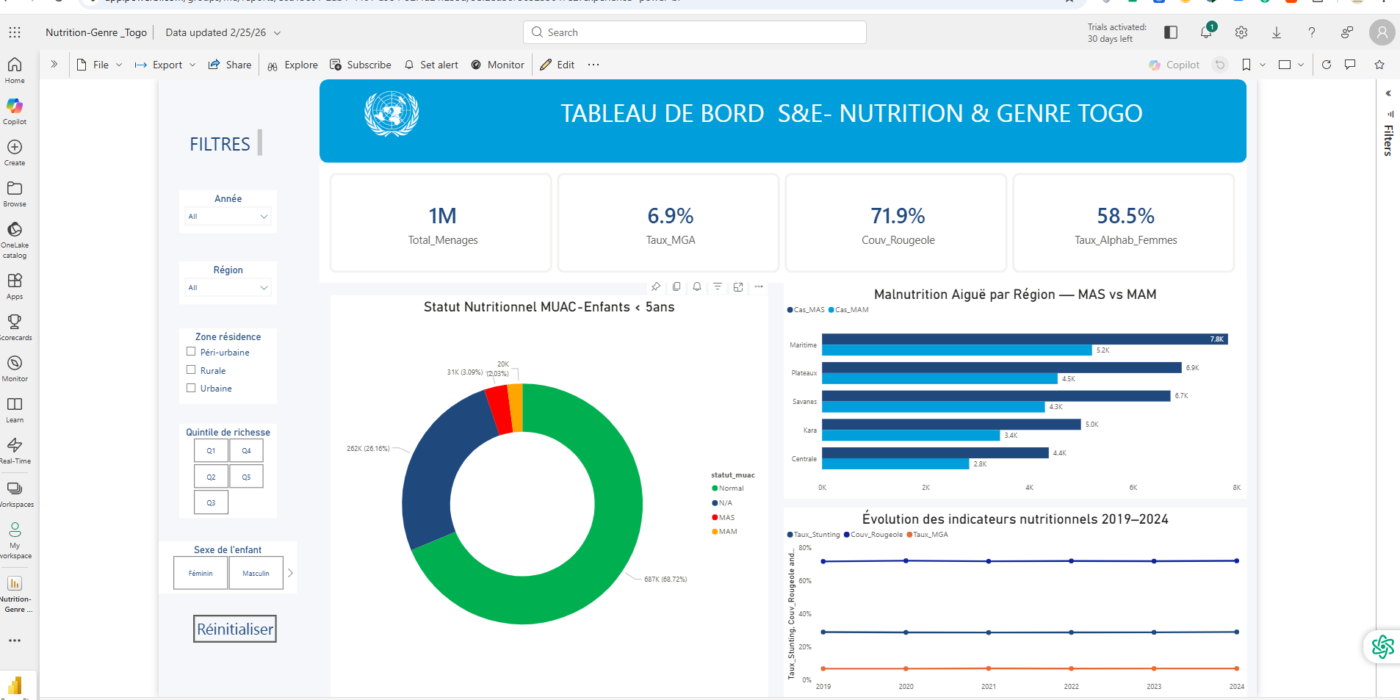
Interactive Power BI Dashboard
3 interactive pages · 15 DAX measures · choropleth map · 2019–2024
trend lines · gender empowerment radar · MAD score by wealth quintile ·
5 synchronized cross-page slicers.
View Dashboard →
📄
M&E Analytical Report
7-section report built on real WHO/GHO data: regional analysis,
temporal trends, gender equity assessment, and 9 operational
recommendations ranked by priority level. Source: WHO & World Bank.